The K-Shaped Economy
From job creation to consumer spending, the data points to a widening gap that challenges the durability of U.S. growth.
As defined by Investopedia:
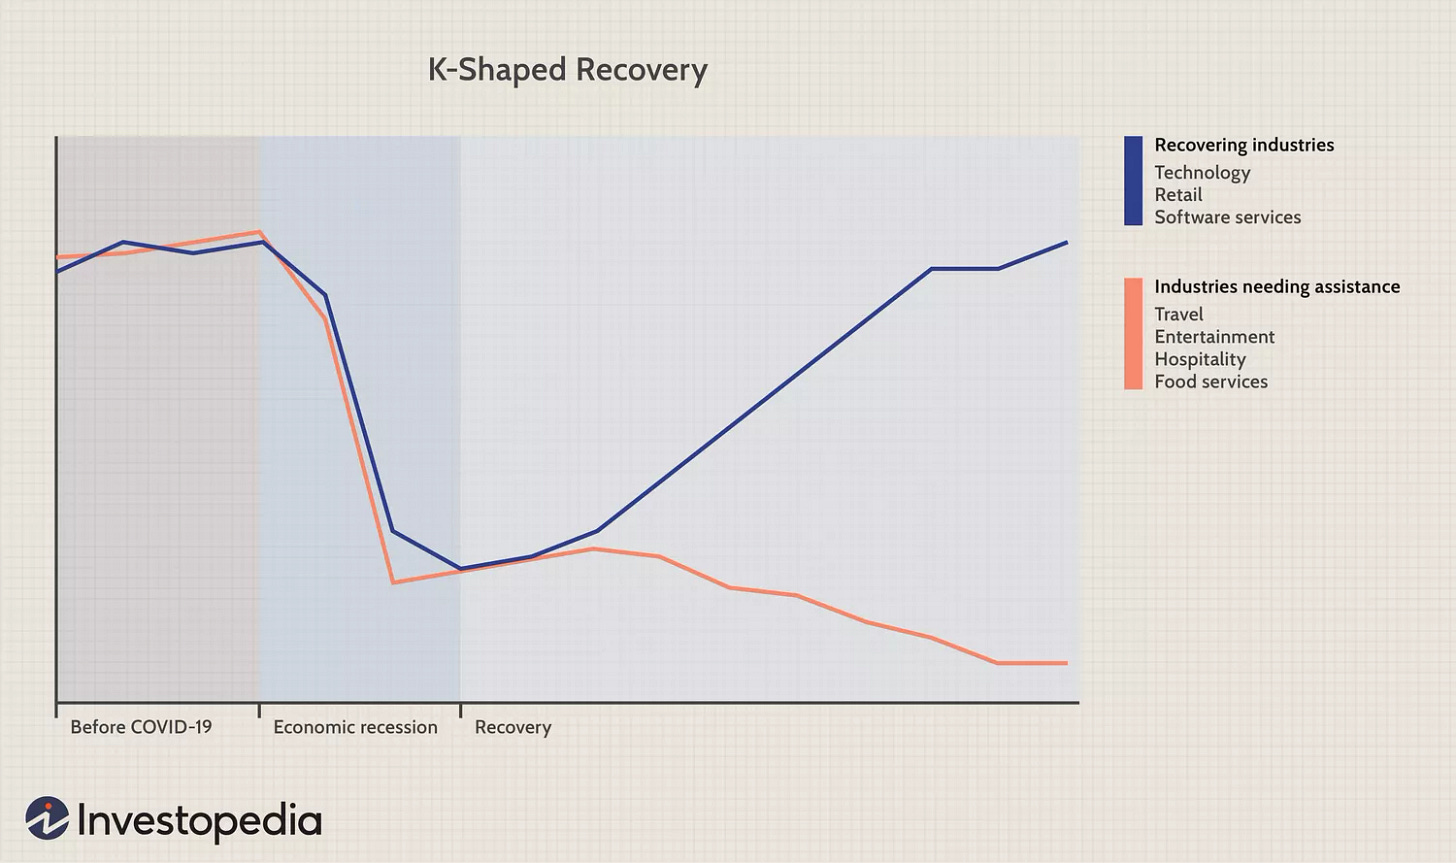
A K-shaped recovery occurs when, following a recession, different parts of the economy recover at different rates, times, or magnitudes.
The chart below illustrates this pattern in the post–COVID-19 recovery. The reason it’s called K-shaped is that different segments of the economy diverged sharply—one rising while another declined—forming the shape of the letter “K.”
Over time, the term has evolved beyond sectoral performance to describe the widening gap between high earners and low earners. A similar “K-shape” emerges when charting the U.S. wealth divide.
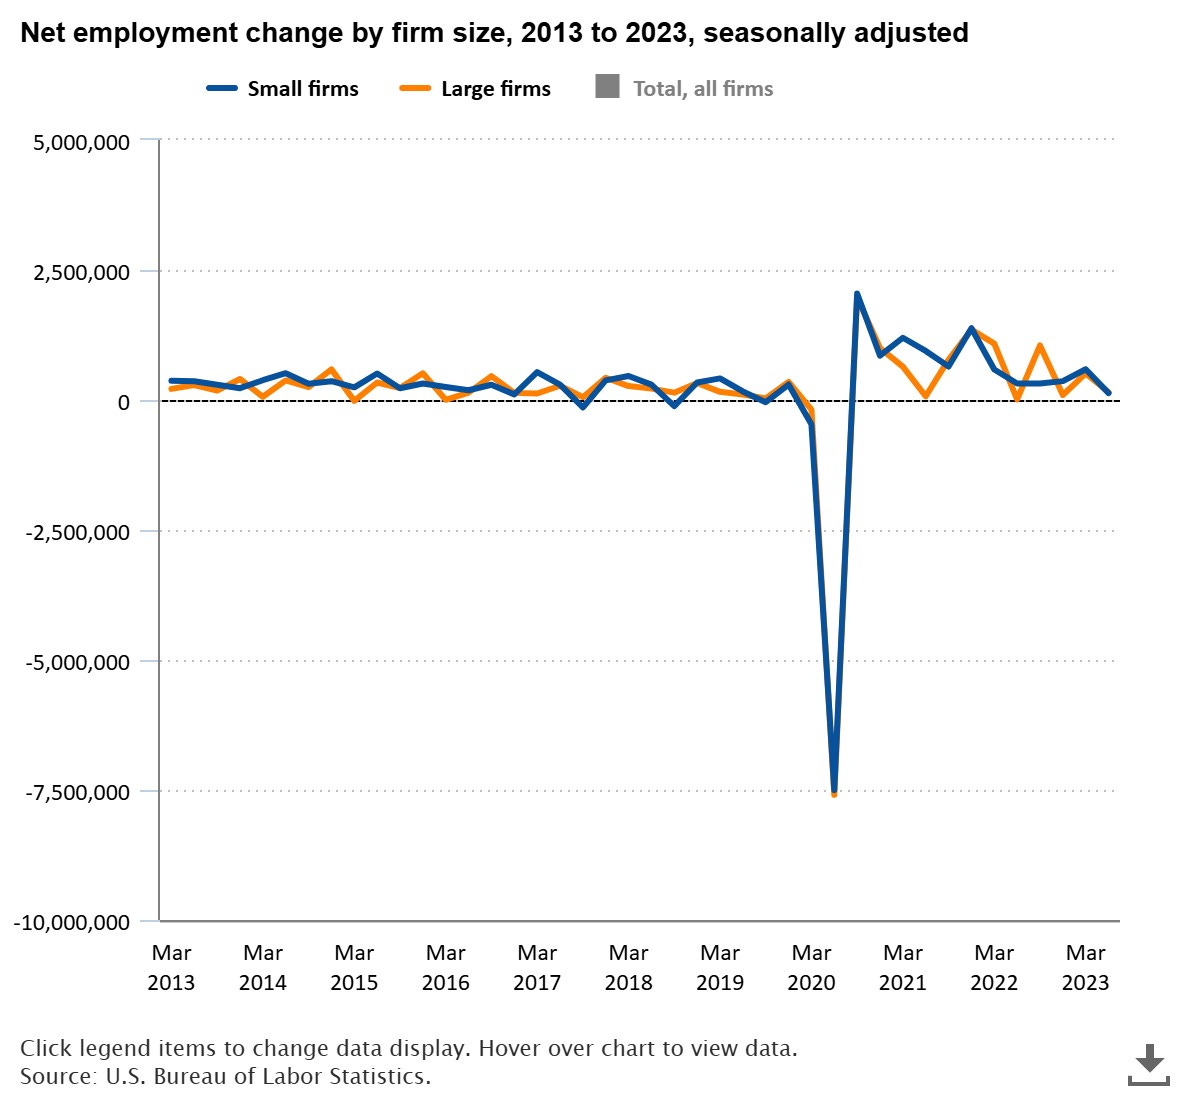
Unfortunately, it’s beginning to look like a K-shape is also forming in the labor market—between large and small firms. That’s concerning because small businesses have long been the backbone of U.S. job creation. According to data from the U.S. Bureau of Labor Statistics (BLS), small businesses accounted for roughly 55% of total net job creation between 2013 and 2023.
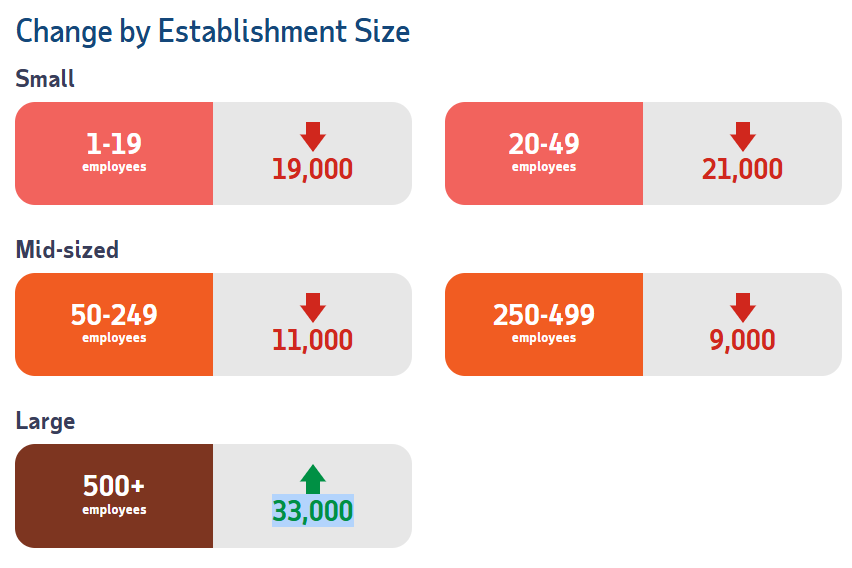
However, recent data from ADP shows this job creation engine is starting to stall. In the most recent report, companies with fewer than 50 employees shed about 40,000 jobs, while those with between 50 and 499 employees lost another 20,000.
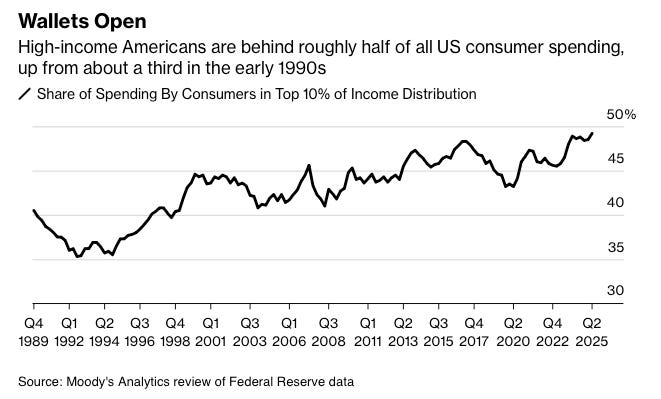
Meanwhile, consumption continues to be disproportionately driven by wealthier households. According to Moody’s Analytics, consumers in the top 10% of the income distribution accounted for 49.2% of total spending in the second quarter—the highest share since 1989. In contrast, the bottom 80% have seen their spending merely keep pace with inflation since the pandemic.
This means that as long as consumer spending props up the economy, it’s higher-income Americans doing most of the heavy lifting. Last week, I noted how AI-related capital expenditure may be masking underlying weakness in growth; similarly, strong aggregate consumer data could be concealing a more uneven, K-shaped reality beneath the surface. Remember, consumer spending makes up about 70% of U.S. GDP—and if only 10% of Americans are driving nearly half of that spending, it signals a structural weakness in the economy’s growth engine.
Disclaimer
The content provided in this newsletter is for informational and educational purposes only and does not constitute financial, investment, or economic advice. The views expressed are solely those of the author and do not necessarily reflect the opinions of any affiliated organizations or employers.
While efforts are made to ensure the accuracy of the information presented, no guarantee is given regarding its completeness, reliability, or suitability for any particular purpose. Readers are encouraged to conduct their own research and consult with a qualified financial advisor before making any investment decisions.
Past performance is not indicative of future results. All investments carry risk, and the value of investments may go down as well as up. The author is not liable for any losses or damages arising from the use of this content.
By subscribing to and reading this newsletter, you acknowledge and agree to this disclaimer.


